A single, 0–100 score that brings together reach & frequency with digital attention and interaction — so brands can finally measure communication impact across every channel.
Compare CTV, digital, social, QR, print, and OOH using a single, unified metric.
Uses the same principles as GRPs and effective reach — not a replacement, but an extension.
Combines viewability, attention time, CTR, and engagement into a measurable quality layer.
UCMI combines audience measurement and digital performance into a single, transparent framework.
Measures how well each impression performs:
Built on reach & frequency logic brands already trust:
UCMI combines reach, frequency, attention, and interaction into one unified score.
Finally evaluate TV, digital, and emerging formats on one scale.
Shift budgets to placements that deliver the highest communication impact.
One number for marketing, analytics, and leadership.
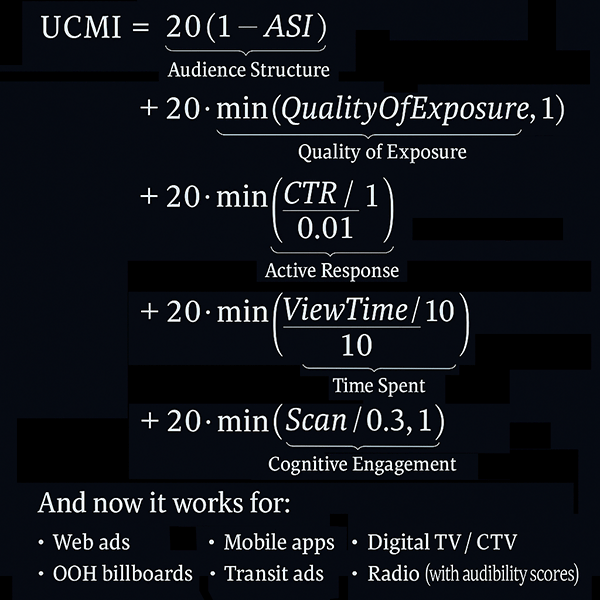
UCMI is computed as a weighted combination of normalized metrics:
The Audience Structure Index (ASI) is derived from:
Full methodology and SQL implementation available upon request.
Move beyond impressions and unify your media performance with UCMI.